My Findings After Experimenting with AI.

Considering the recent advancements with AI technology, my curiosity as to whether AI could enhance trading results led me down a rabbit hole.
Over the past few months I've spent countless hours asking questions to Chat Gpt, claude and Gemini.
For the purpose of this article I settled on Gemini, ultimately paying £20 per month to have uninhibited access but you could come to the same conclusions using the free version.
I learned very quickly that although AI has great intelligence, far greater than any human, super human intelligence answering complex questions in the blink of an eye. It is prone to assumptions and mistakes and there is definitely a certain way of speaking to AI.
I learned that although extremely good at problem solving, it doesn't necessarily take into account the potential problem 'the fix' could cause. You must be very precise when explaining your requirements and you can not assume AI will always remember specific requirements.
I started out by asking:
How important is the S&P in regards to currency trading?
What is the best way to guage institutional volume in the S&P?
What is moving the S&P at today's American open?
Are there any specific 'high probability' Forex trading strategies?.
I was also curious to have a conversation about the psychological aspects of trading.
I learned that the S&P is important, in fact, AUD JPY is correlated to the S&P about 70% of the time on an intra-day basis. Rising to 80% during 'news events'. But, rather than the S&P, the best actual guage of 'institutional money' is the S&P emini futures.
I learned that the American open, specifically the first 30 minutes is a complex web of 'positioning / profit taking / rebalancing. And that it's difficult to have confidence in a directional move until after the first 30 minutes has completed.
I learned that a good guage of whether institutional money is in a move is RVOL, specifically S&P EMINI RVOL. If the number is between 1.5, and 2, it's a good indication that the big players are involved.
Did AI suggest any strategies? This was the question I was probably most intrigued by. Would it be possible to create an indicator to give me a 'signal'? Considering I've consistently championed 'not' using technical indicators, I was very intrigued.
Two suggestions caught my eye. A VWAP rejection play. And an ASIAN session breakout play.
I'd never heard of the VWAP before, it's a 'fair value guage'. The idea being: price stretches away from the VWAP, reverts to re-test and once the retest is rejected, price continues in the prevailing direction. Incorporating the risk environment and RVOL. I set about creating an indicator.
Countless attempts later, I had something I could upload to Tradingview. The metrics for the VWAP rejection were in place, the background has a 'risk environment ribbon', 'Trin' was considered (something else I'd never heard of but worth reading up on). But I ultimately settled on the 'risk environment ribbon' being determined by the 40 period EMA moving average (15min chart) on the VIX futures. If price is above the EMA a red background, if below the EMA a green background. The S&P EMINI RVOL of the time is taken into consideration.
I have to say, my initial findings were very encouraging. The chart looks great. And the 'signals' seemed to align with my overall market thoughts.
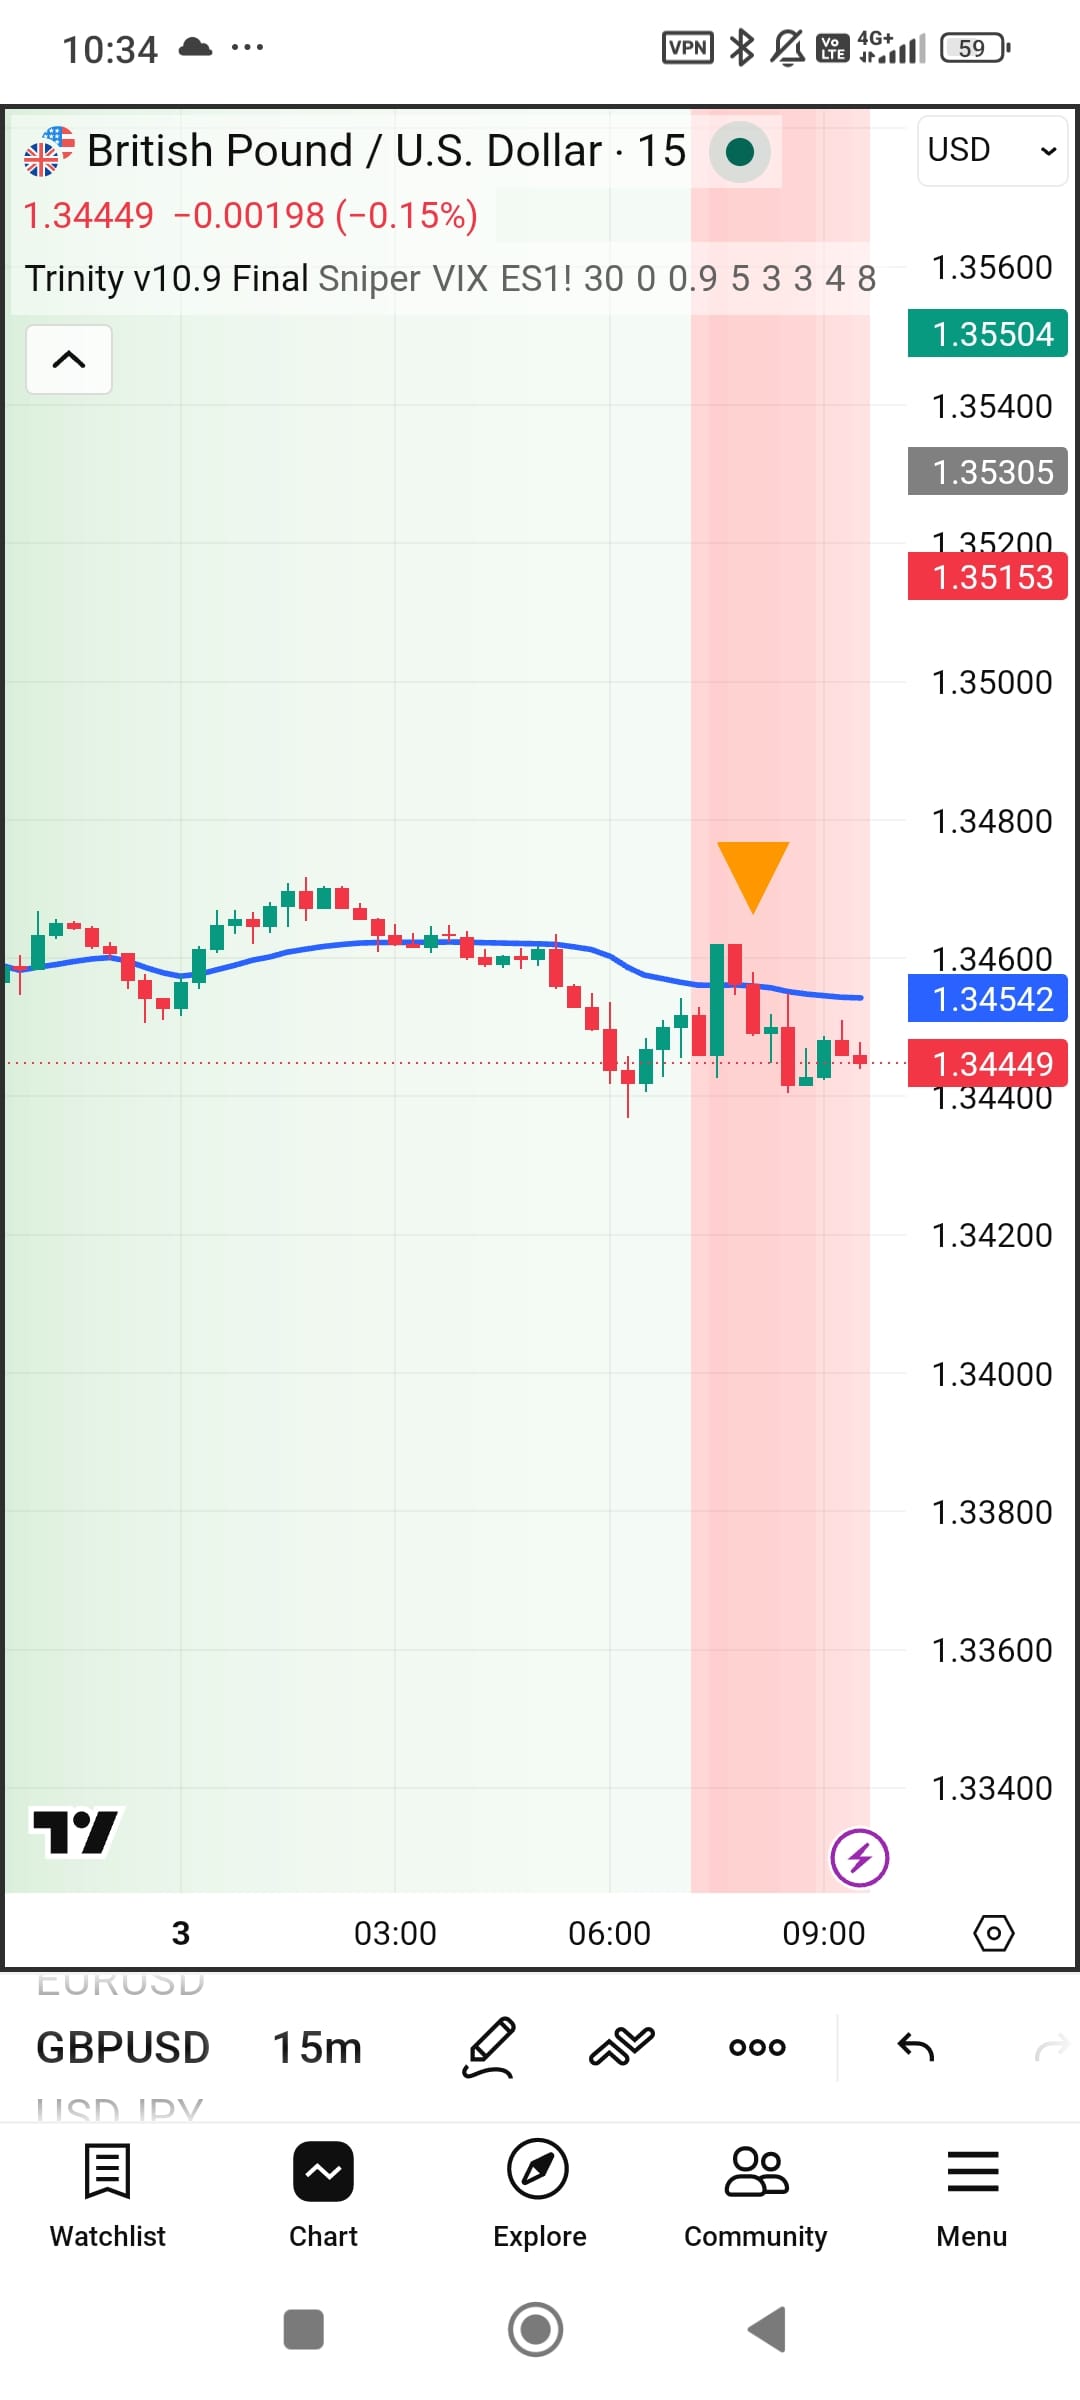
(The above screenshot is one of the many indicators I uploaded to Tradingview, the arrow is the 'signal' for a 'VWAP rejection trade' as the risk environment turns negative and the volume requirement was met. The screenshot was taken during the European session on the day I'm writing this, June 3 2026. The market is currently stuck in the mire of the US / IRAN 'stalemate').
As my conversations with Gemini continued, an extra 'entry' emerged. Regarding the moments you have a bias for a currency but you feel the move is already overbought / oversold. I was trying to see if we could find a 'signal' to say 'now is the time'.
Again, the idea revolves around the VWAP, it's a 'divergence play'. Price moves away from VWAP, pulled back towards it, looks like could be about to push through and go in the opposite direction. But it's a 'trap'.
Price is likely to continue in the original direction you wanted to trade.
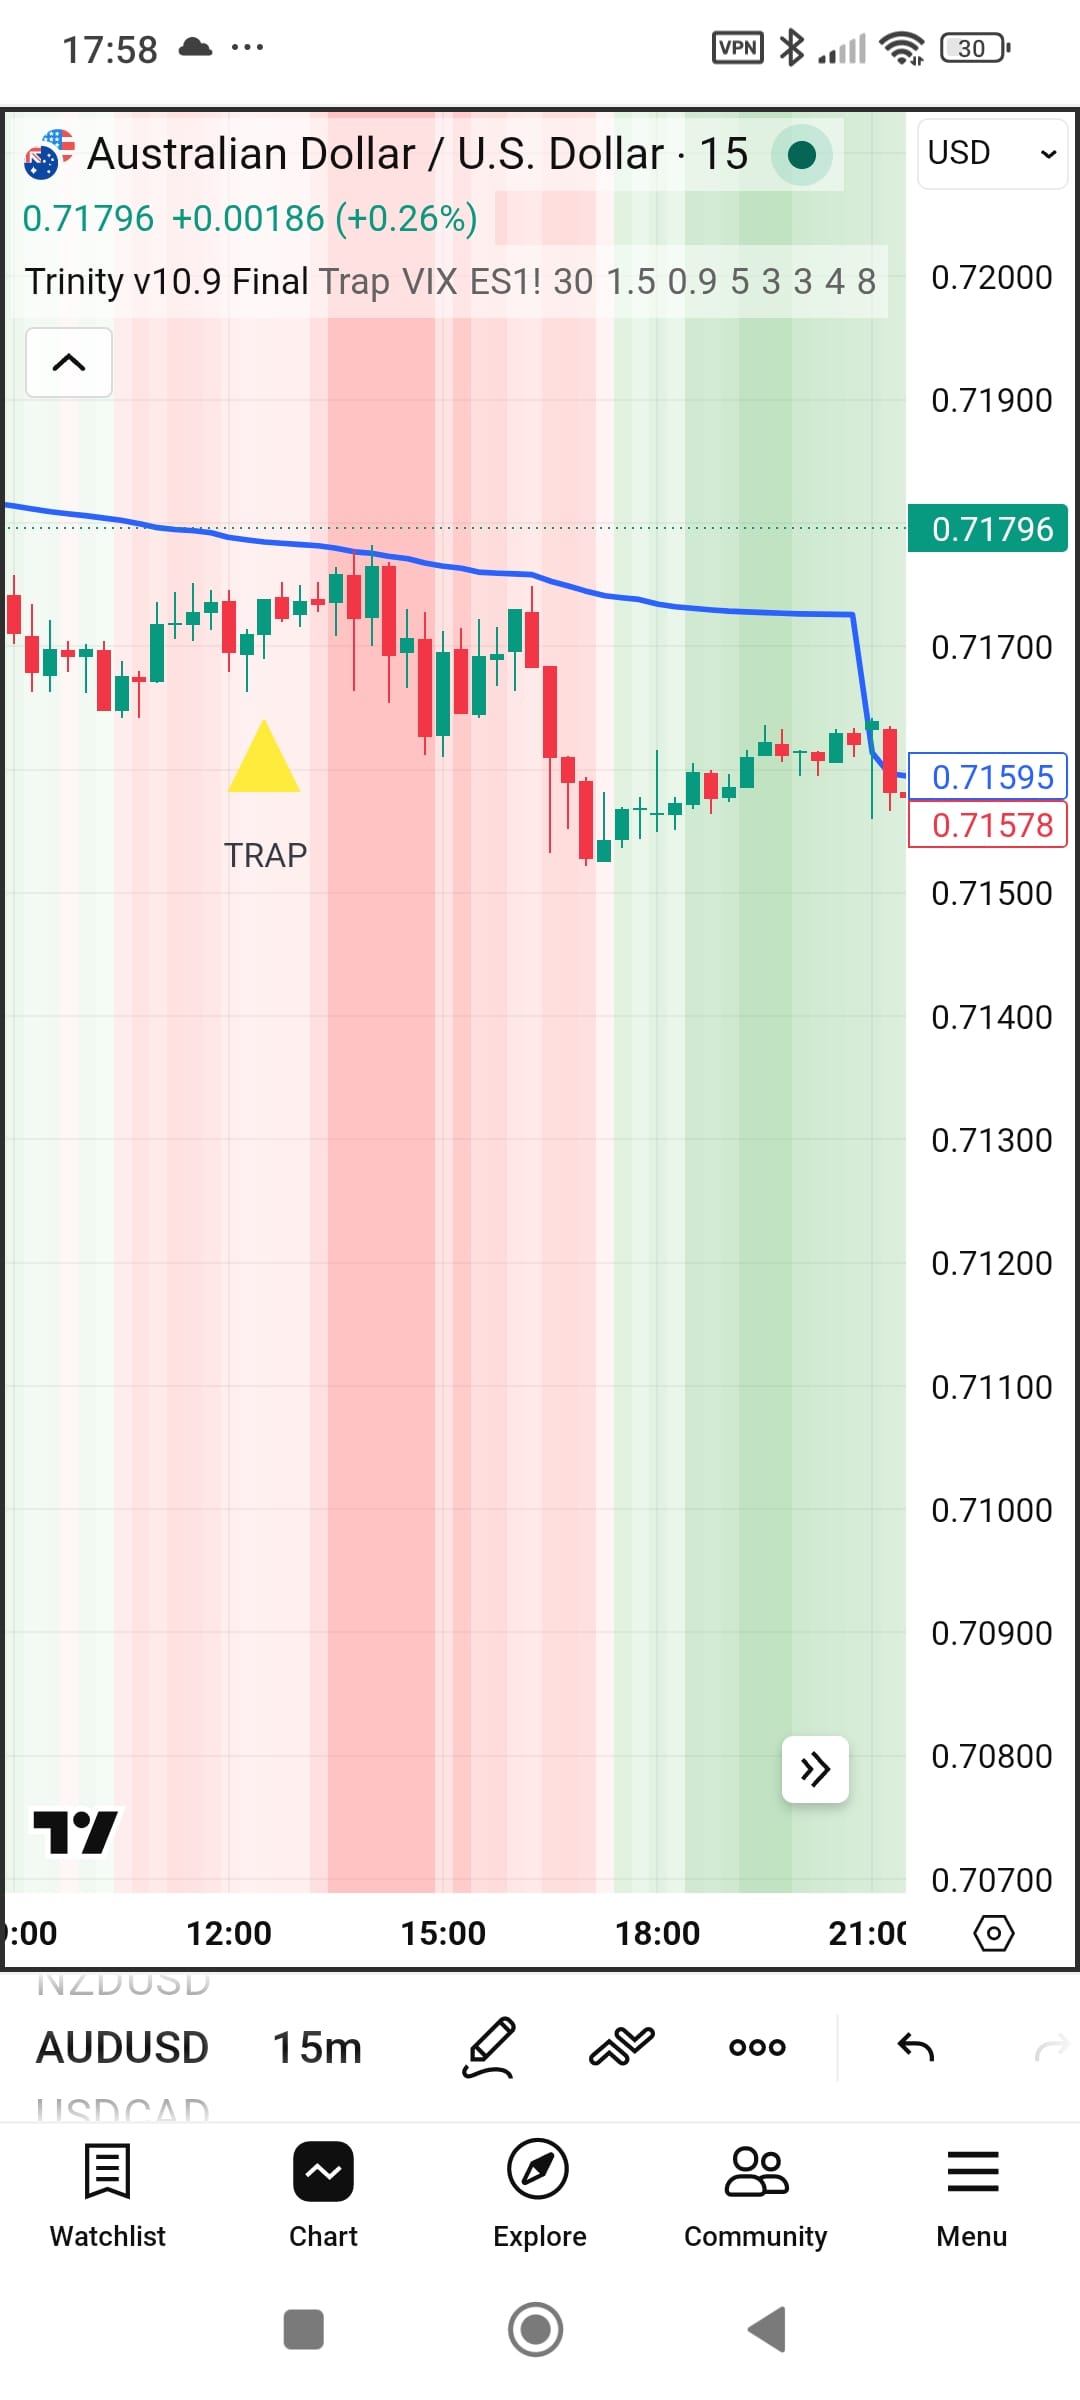
(The above screenshot is an example of that moment. In this scenario, the 'trap' is that price will (rather, is likely, to continue lower)
As I said, initially I was very encouraged. For a while I thought it was going to develop into my new way of trading. But. And it's a big BUT. As time passed, I started to get the sense I may as well have been trading a slow stochastic or moving average 'crossover'. I often found myself in the conundrum of what happens if a 'signal' didn't align with my thoughts?. Or what should I do if I think there is a trade but there is no signal? All in all it got a bit messy. I found the indicator enticed me to trade even though It wouldn't be a trade I'd normally take.
After a few months of testing (in demo account) I've come to the conclusion that I'm not going to add the indicator to my everyday trading, ultimately, I feel more confident in my own day to day understanding of the market, combined with using fractals to guage a stop loss and profit target.
So, for now, after much toiling and second guessing, I'm (I think) pleased to report that I don't think that an AI suggested indicator could beat human intuition. I do think it works well (remembering that 'works well' means a 50% win rate) in a 'trending market', on a 15 min timeframe. But when 'price' is going sideways in a confused market', the indicator offered too many 'signals'. And my brain just couldn't comprehend the overload.
The bottom line is that if I need to be aware of market fundamentals to have an opinion on a 'signal'. I still don't think there is a better combination than: Knowledge/ human eyes/ fractals.
That's not to say it won't change in the future, as AI advances I suspect my curiosity will lead me to revisit other ideas.
ASIAN session breakout:
The ASIAN session 'breakout' is a little different. The theory being, if price breaks the 'ASIAN range' early in the European session, it's an indication of the mood for the session. Gemini suggested it works well on GBP USD in particular. And I agree.
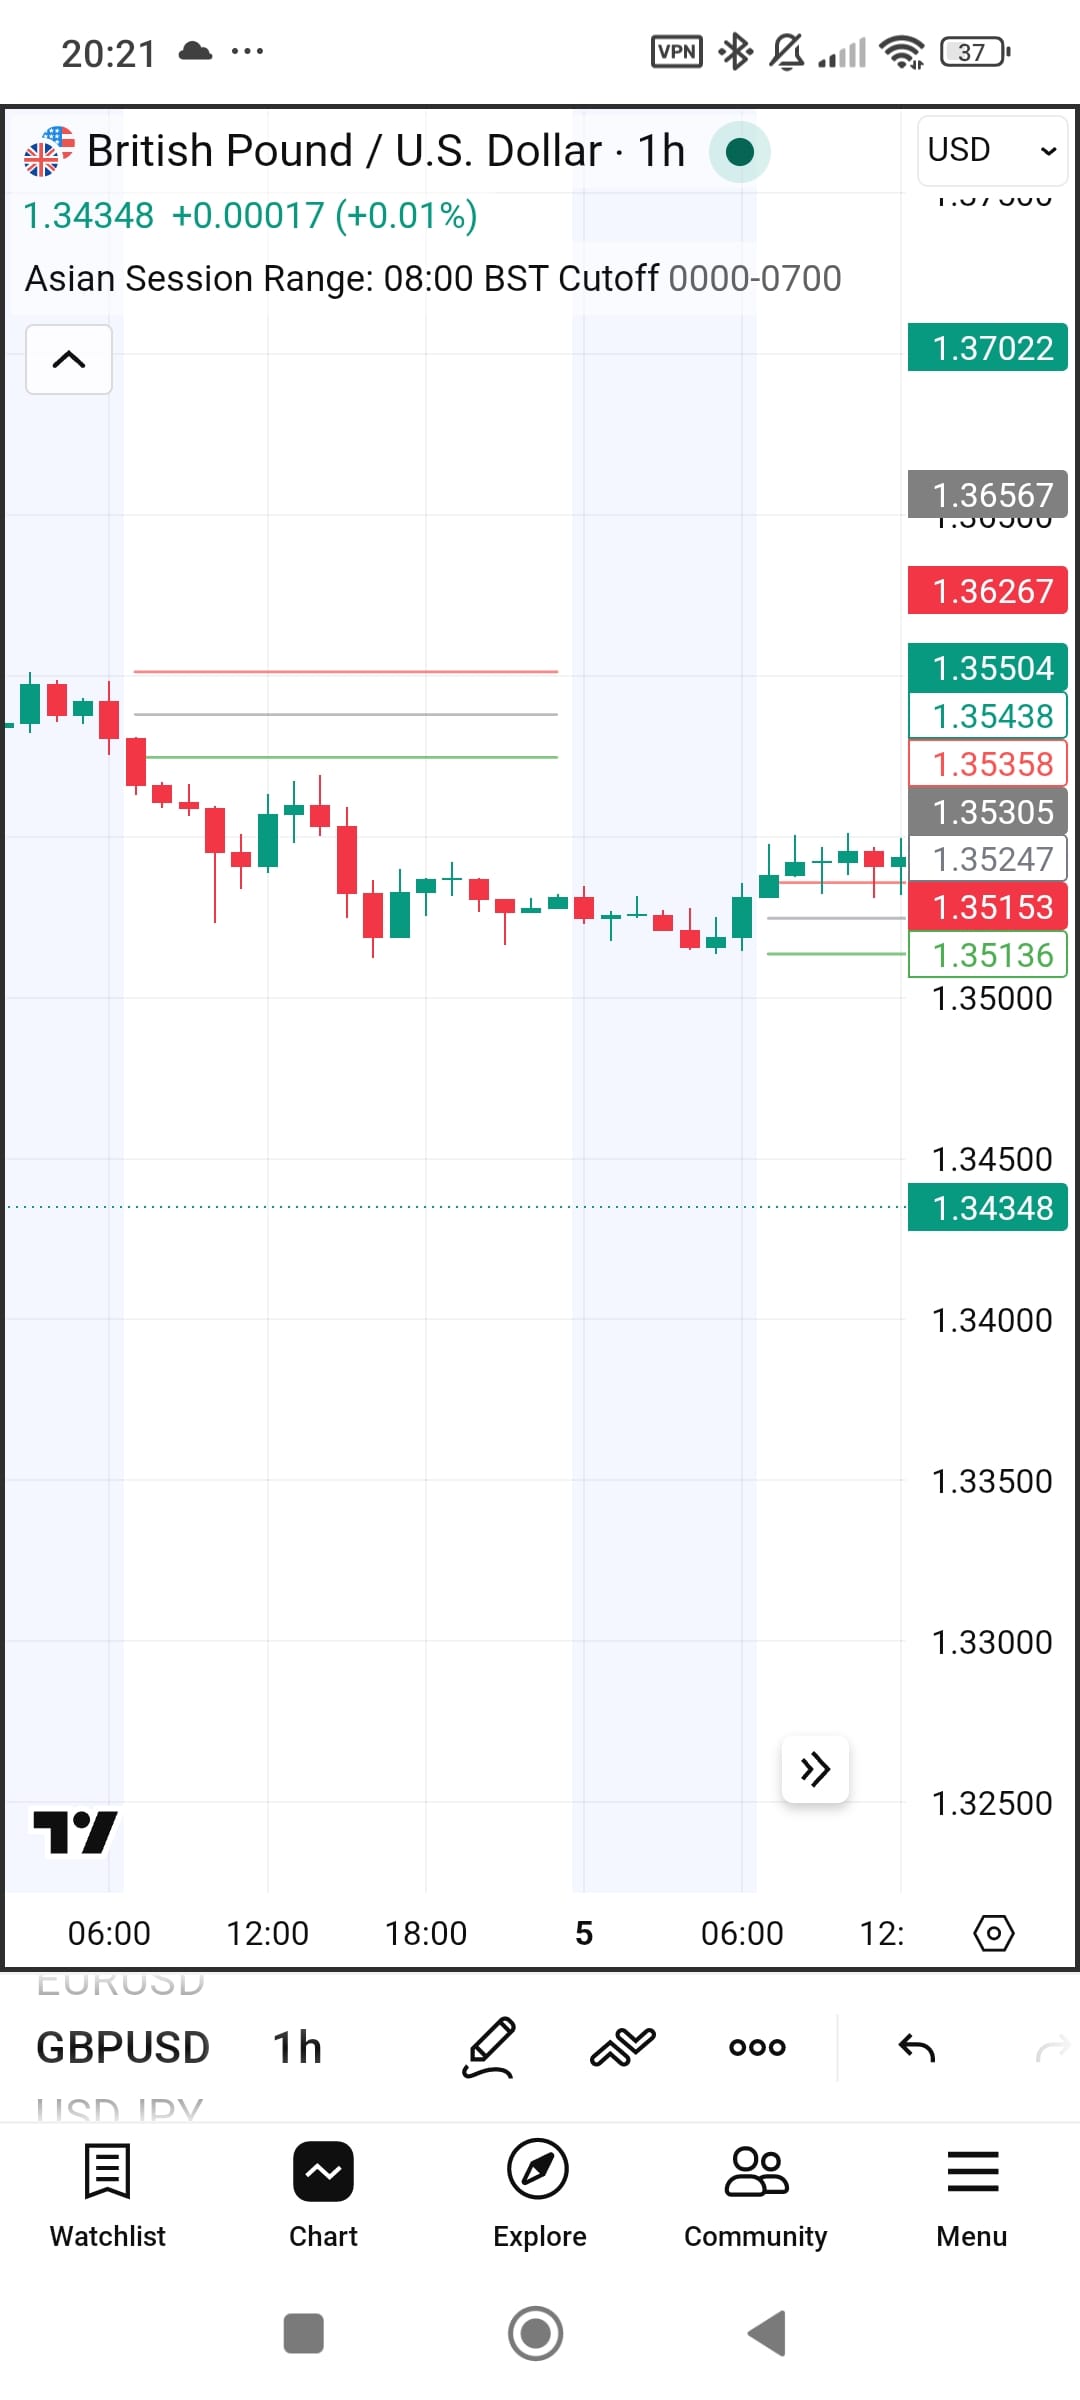
(The above screen shot shows GBP USD 'breaking' the ASIAN session low' early in the European session).
It's something I'm still in the process of 'testing'. So far, my findings are encouraging, especially when price breaks during early Europe, 7:30 to 8:30 UK time, the chart does 'quite often' continue in the direction of the break, at least until the American session. BUT, it's important not to fall into the trap of blindly trading a break, it must align with either the overall risk environment or UK data, preferably both.
Unfortunately I can't offer conclusive proof because I'm still 'testing' but my best guess is that the strategy will offer an average of 2 trades per month, mainly in those weeks when the UK has a Slue of data released early European session. Remembering that 'a good strategy' yields a 50% win rate, I do think soley trading a GBP USD 'ASIAN breakout' 'could' be a good strategy.
It does lead me to thoughts of 'what about a European breakout strategy' at the beginning of the North America session?
Or what about an 'S&P breakout strategy' as the 'big players' decide on their moves at the start the day?
But for now, I'm going to focus on the 'ASIAN session breakout'. Whilst continuing to focus on the markets in the same way I have done for the last 10 years: Understanding fundamentals / momentum / fractals.
S&P:
As I mentioned earlier, the 'goings on' during the first 30 minutes of the American open at the US open makes it difficult to have faith in a move until those first 30 minutes have completed. My thoughts are that there are occasions when a piece of news is so strong 'pre open', you can only envision price going in a certain direction. On those occasions, I am happy to place a trade. But on 'quiet news days' or days when US data isn't particularly 'outside of concencious', on those occasions I think it's prudent to wait until the first 30 minutes has completed.
PSYCHOLOGY:
For a long time I've tried to pinpoint how to explain the psychology of trading. I do think my book's 'psychology section' does a decent job. But I've been searching for a deeper way to explain trading psychology. Specifically, why do we place trades we know we shouldn't? And how to combat it.
Unfortunately, that is a whole separate article, probably a whole new book. But for now I'll leave you with the suggestion that whichever category a trader finds themselves in: over trading / under trading / constantly checking a trade once it's placed. Millions of traders find themselves in one or more of these categories. The quick answer is, it's the human brain searching for dopamine.
The trick is to train your brain to search for the dopamine derived from simply making a good decision.
Amongst trying to compete my 'consistent profits course', I will delve deeper. But for now, I'll focus on the US / IRAN headlines and whichever direction they will take the market next.
Please feel free to email any thoughts or questions, maybe you have different AI conclusions: johnelfedforexblog@gmail.com
.